

Why use Graphs and Charts?
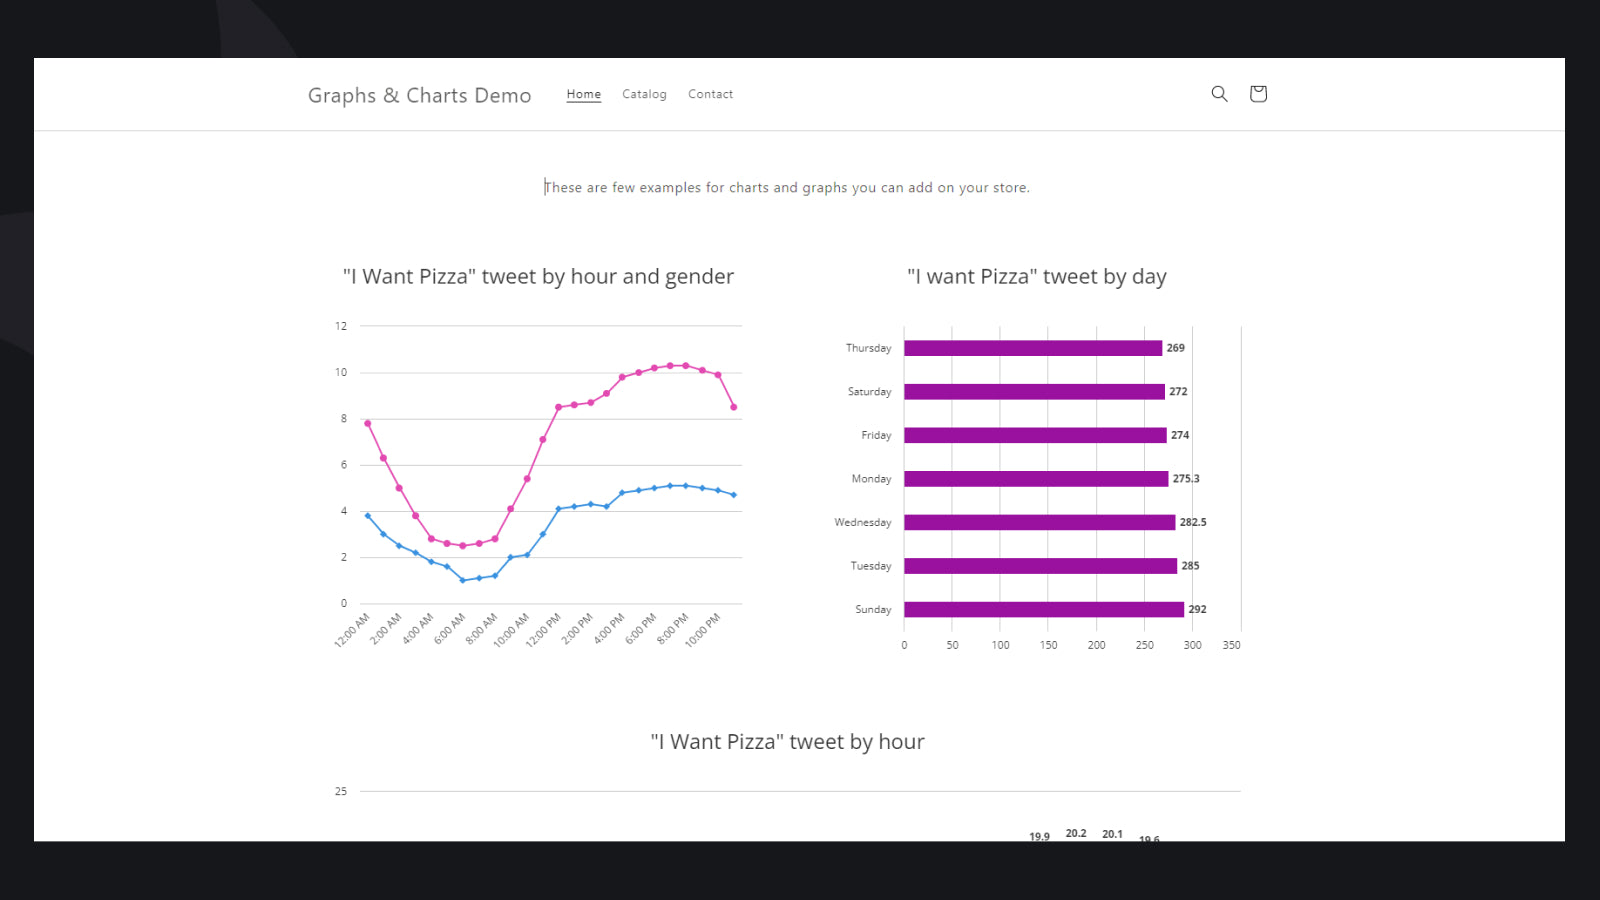
Data displayed on your store needs to be as engaging as possible so store visitors don’t miss out on critical information. With Graphs & Charts Maker, you can easily create and manage interactive and responsive charts and graphs on your store.
What is the Graphs and Charts Maker?
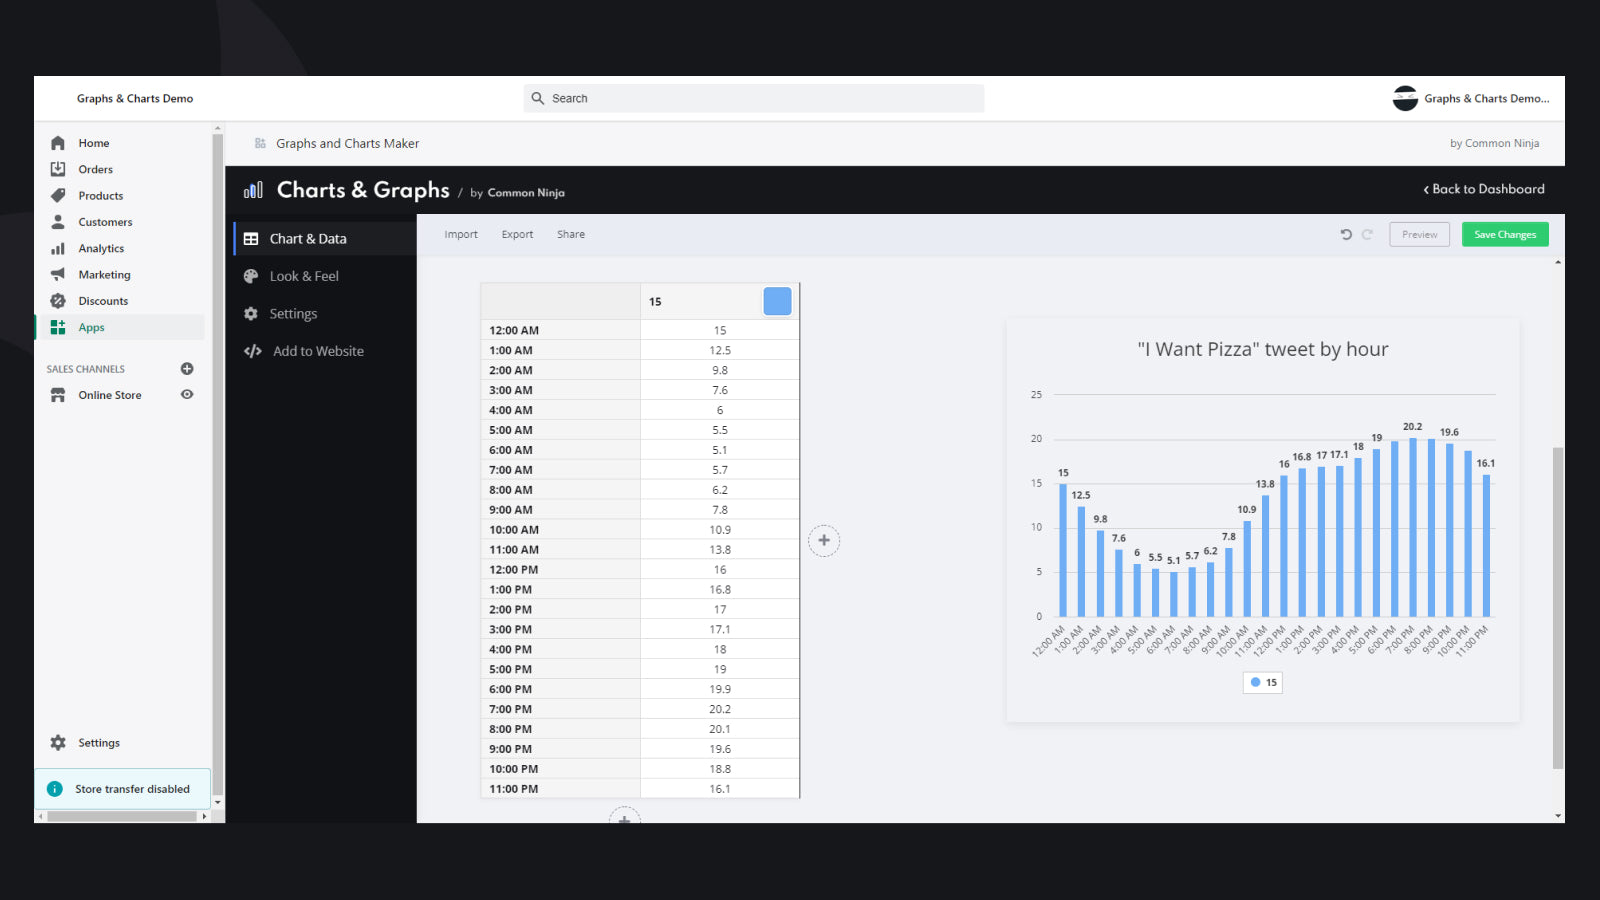
Graphs & Charts Maker is a powerful data visualization generator that gives you the ability to create a great variety of charts and graphs with exceptional customizability. A spreadsheet interface lets you manage data sets on your store and display that data as a beautiful chart or graph.
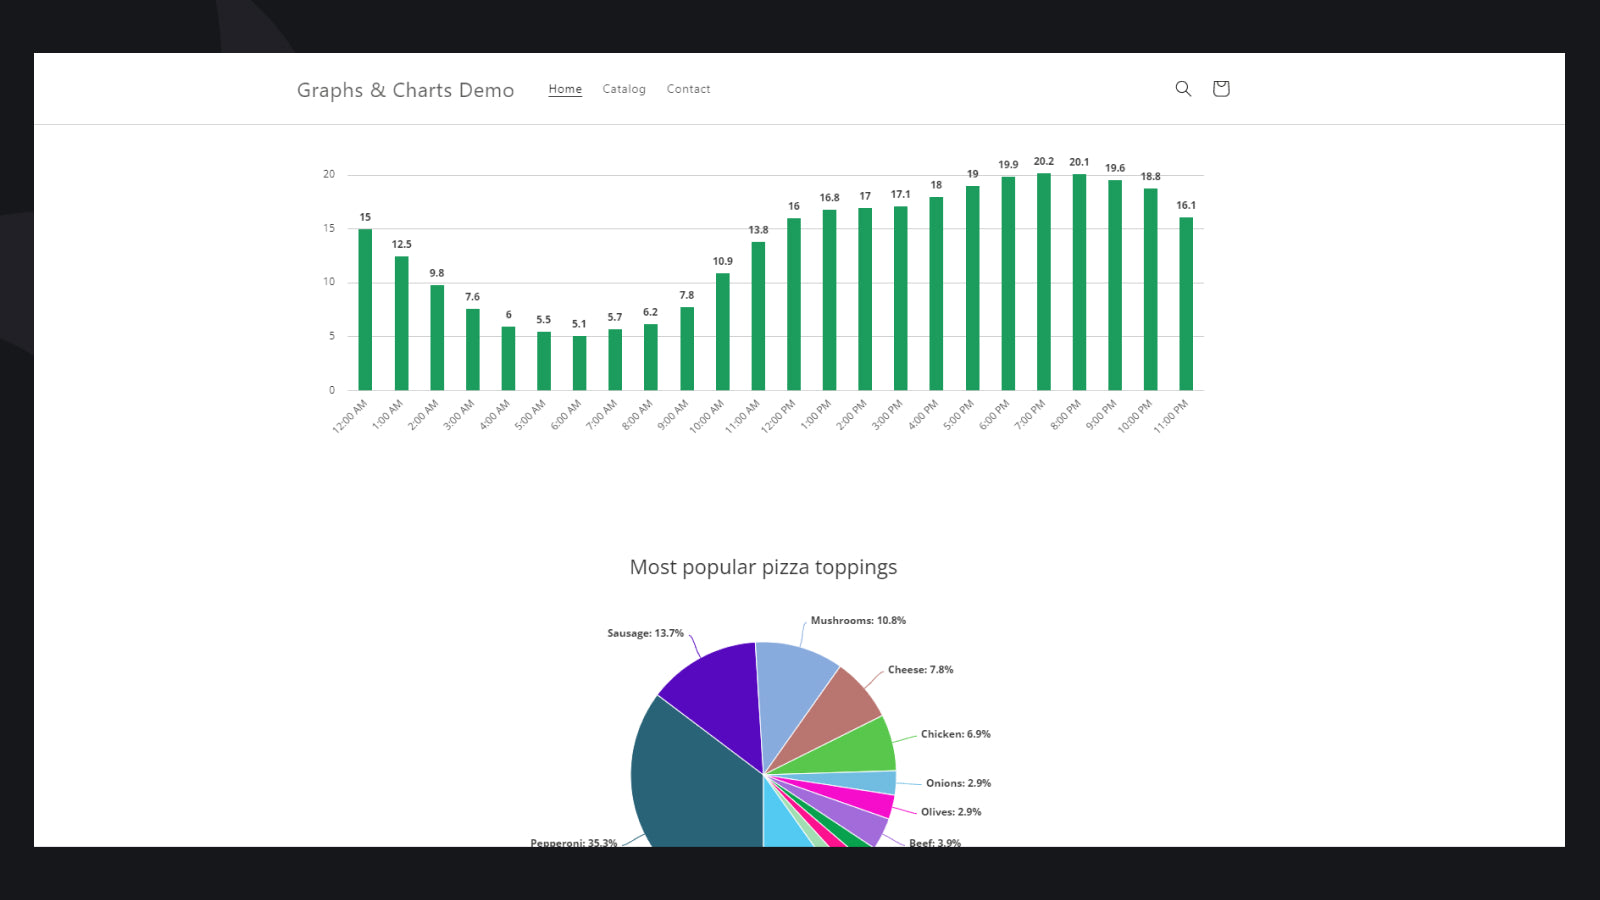
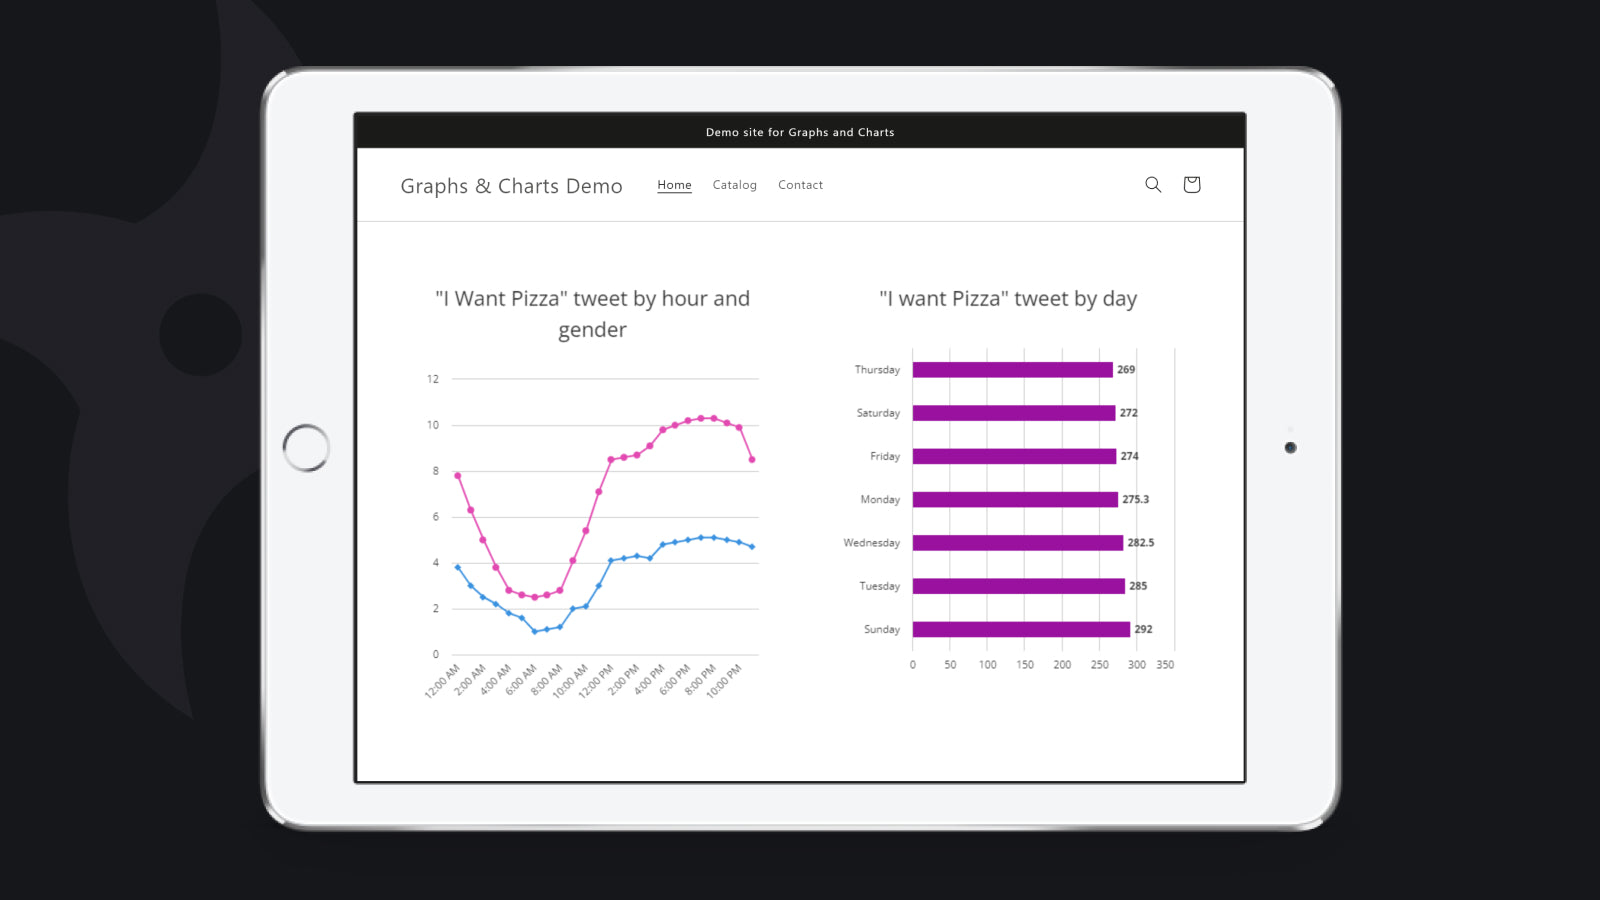
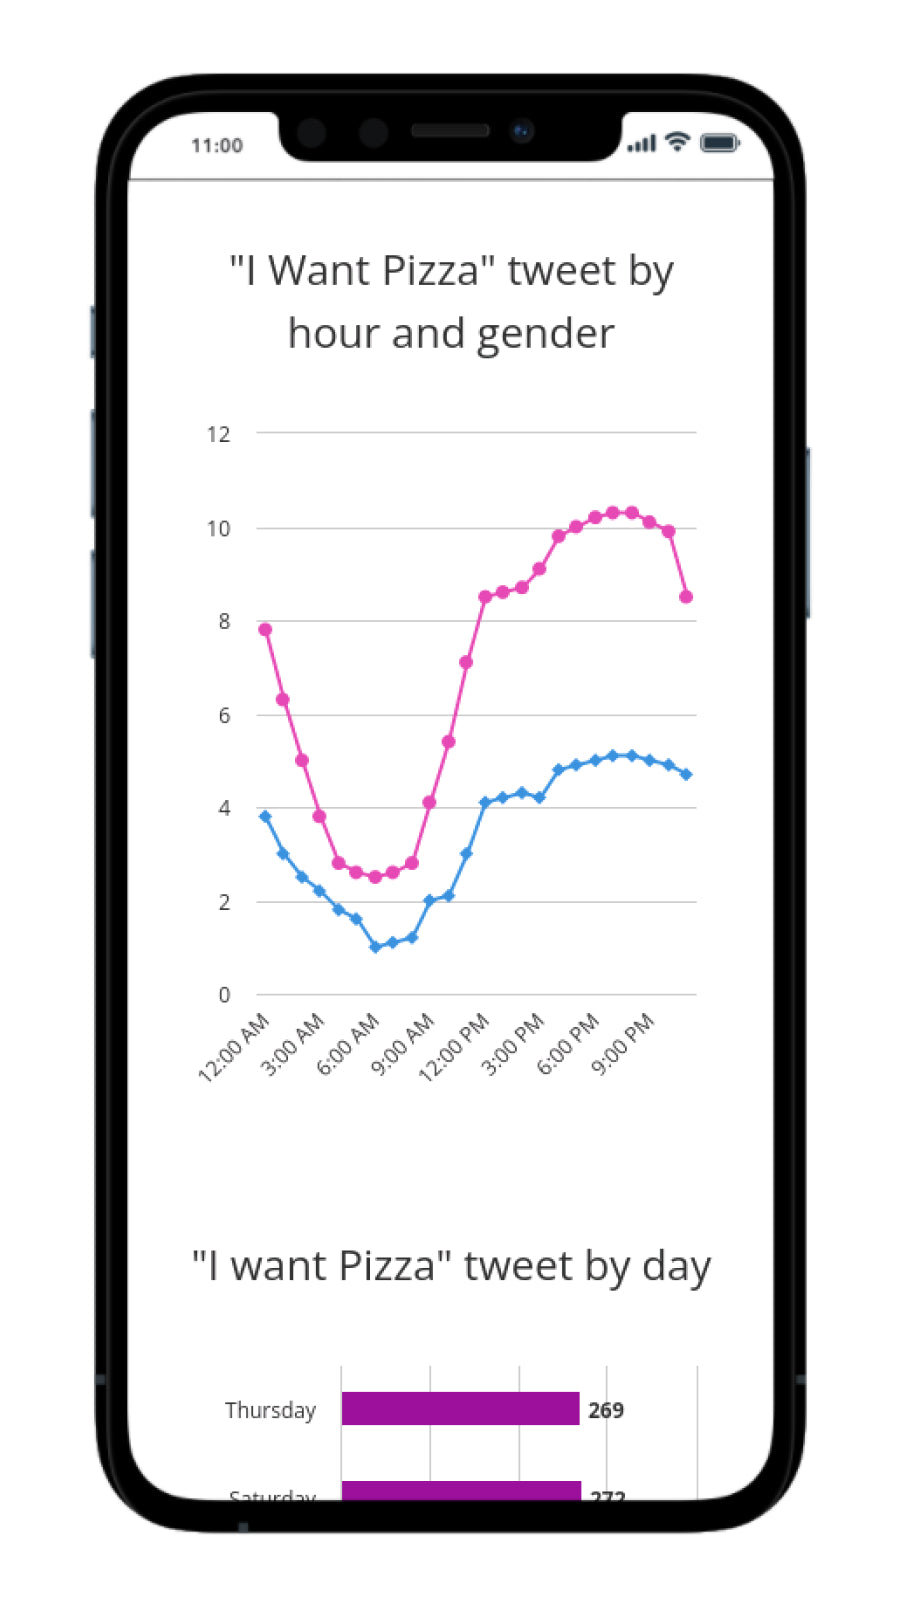
A wide variety of charts, including 3D charts
Choose from a variety of chart types to build a visualization that accurately conveys your data. You can get all the charts you need in one place: bar charts, pie charts, area charts, stacked charts, radial charts, spider web charts, radar charts, and many more!
Easily create interactive charts from any CSV files.
An awesome and time-saving feature of the Graphs & Charts Maker is the ability to import your CSV file to create beautiful visualizations. Instead of manually entering the data in, simply import a CSV file every time you make changes, and let Graphs & Charts Maker do the rest.
Update your charts automatically from a remote URL
One of the most powerful and robust features of the Graphs & Charts Maker is the ability to load the chart’s data dynamically from a remote URL, such as Google Sheets, Github, etc. The charts on your store will automatically refresh and update, as you update your remote data source.
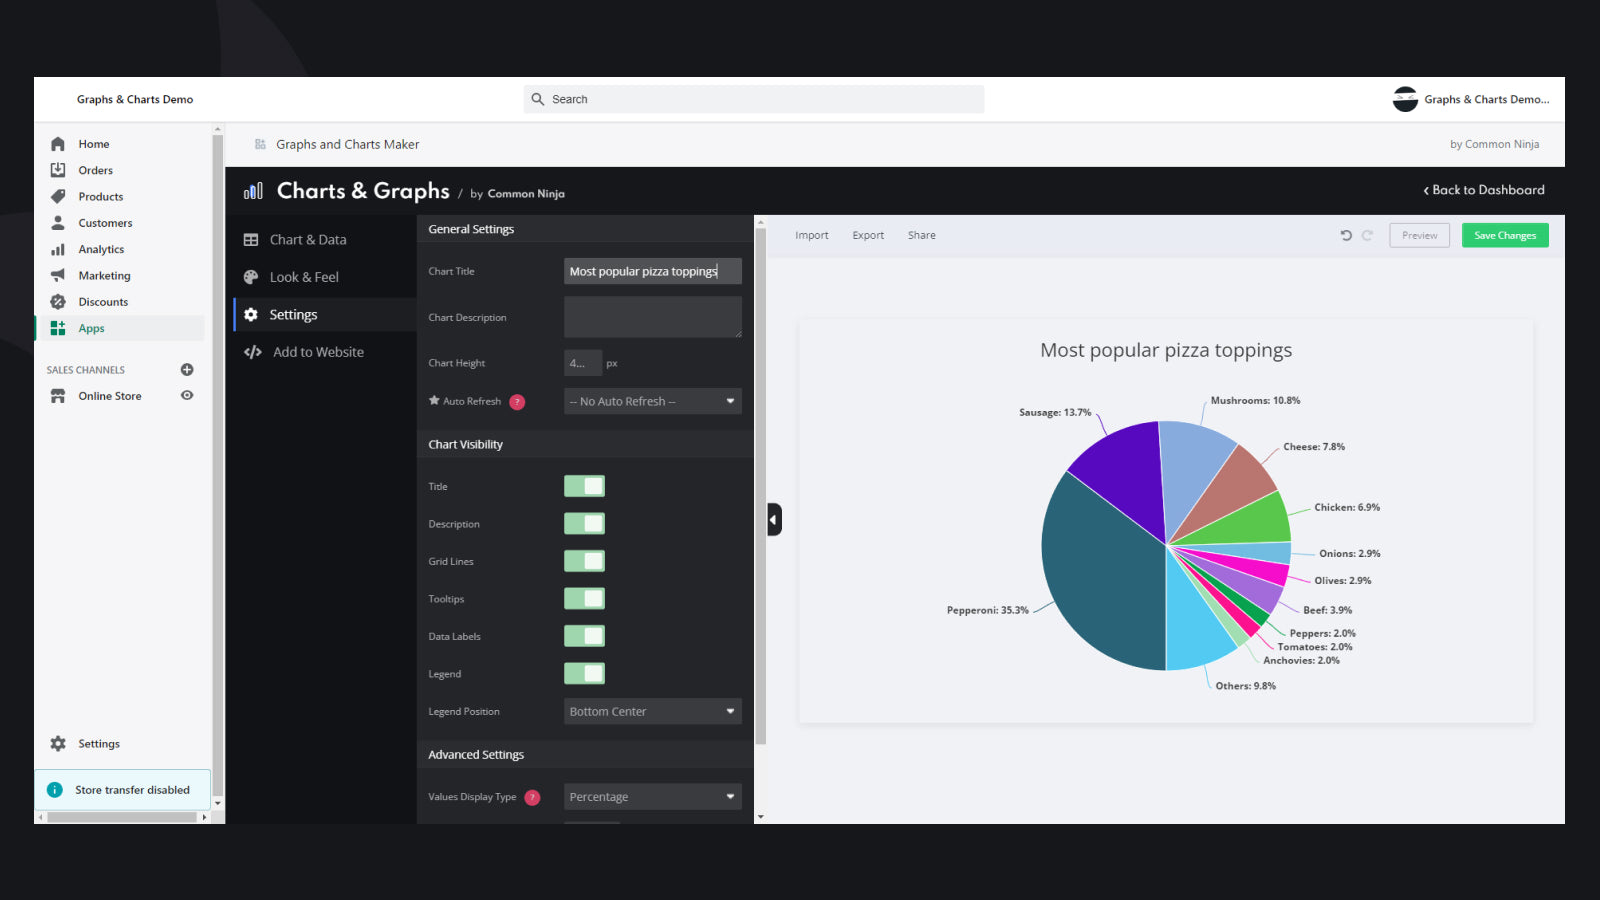
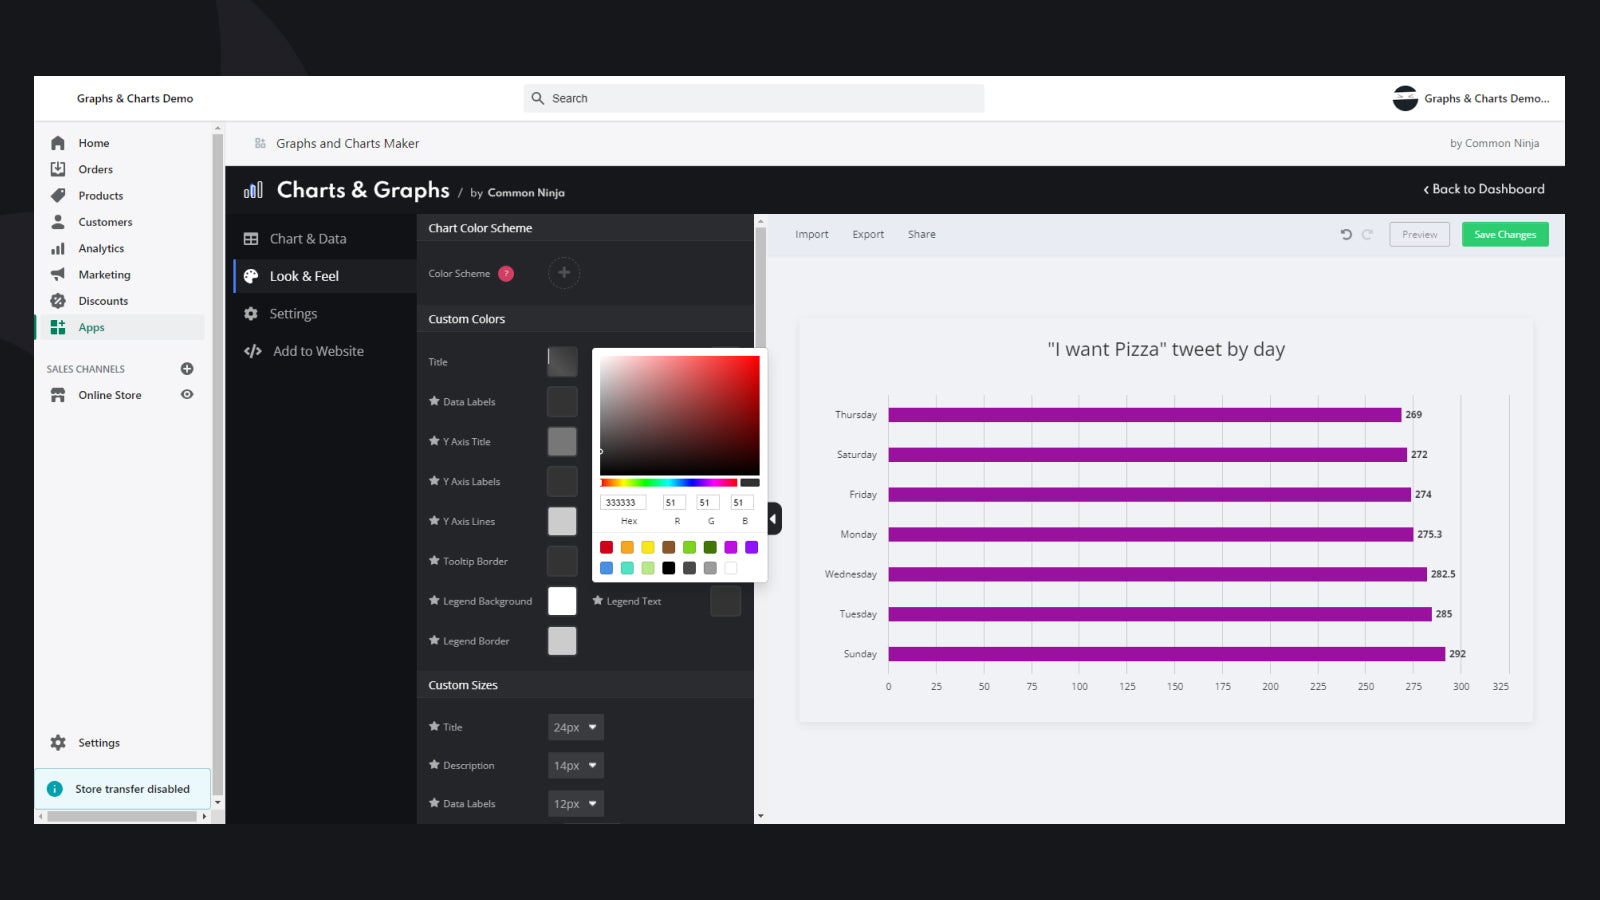
Endless design options
You can customize an extensive set of options to perfectly match the look and feel of your store. You can add a color scheme, edit the axis copy, change the font size, and control the units of numbers.
